


Tech
RF Over Fiber (RF Over Glass): Why Radio Frequency Signals Are Moving to Fiber

Key Takeaways
|
What is RF over fiber (RF over glass)?
RF over fiber and RF over glass refer to the same technology: a way of carrying a radio frequency signal across a site, a building, or a long outdoor run using optical fiber instead of coaxial cable. A transmitter (Tx) module at one end converts the incoming RF signal to a modulated optical signal, sends it down a single-mode fiber, and a receiver (Rx) module at the far end converts it back into an RF signal that is, in principle, identical to the original input. Both modules are typically compact enough to fit in the palm of a hand, and a link can be built as unidirectional or bidirectional depending on whether the application needs signal to travel one way or both.
Why does coax struggle where radio frequency over fiber doesn’t?
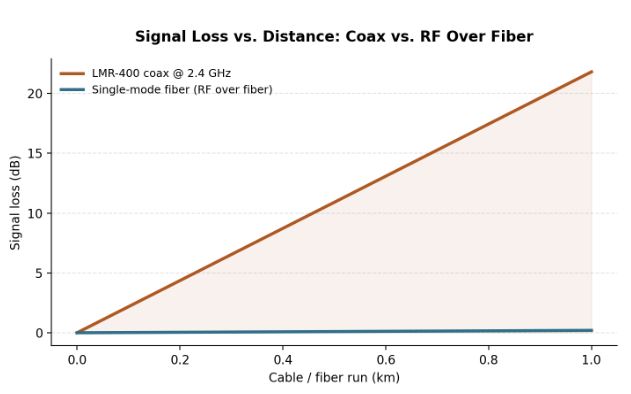
Coaxial cable loses signal strength as a function of both distance and frequency, and that loss compounds quickly. A widely used low-loss coax cable like LMR-400 loses about 6.65 dB per 100 feet at 2.4 GHz, which works out to roughly 22 dB per kilometer, a level of attenuation that can make a link unusable well before it reaches a full kilometer. Higher frequencies make the problem worse: the same cable loses even more per foot as the signal frequency climbs, which is why coax-based RF distribution tends to top out at fairly short, low-frequency runs.
Signal loss versus distance for LMR-400 coax at 2.4 GHz compared with single-mode fiber used in RF over fiber links.
Single-mode fiber, by contrast, loses only about 0.2 dB per kilometer at the wavelengths RF over fiber systems typically use, and that loss barely changes with the RF frequency being carried. A radio frequency over fiber link can therefore carry a clean signal for kilometers with a flat response across its whole operating bandwidth, which is simply not physically possible with coax once the frequency or the distance gets high enough.
How big is the demand for RF over fiber becoming?
Demand for RF over fiber has grown alongside the broader shift toward fiber-based infrastructure. Fortune Business Insights’ RF-over-fiber market report values the global market at $686.2 million in 2025, projected to grow to $745.8 million in 2026 and reach $1.44 billion by 2034, a compound annual growth rate of 8.60%. The report credits strong telecommunications infrastructure and early adoption of advanced fiber technologies in North America, which held a 37.8% share of the market in 2025, with applications spanning telecommunications, navigation, broadcasting, radar systems, and satellite communications.
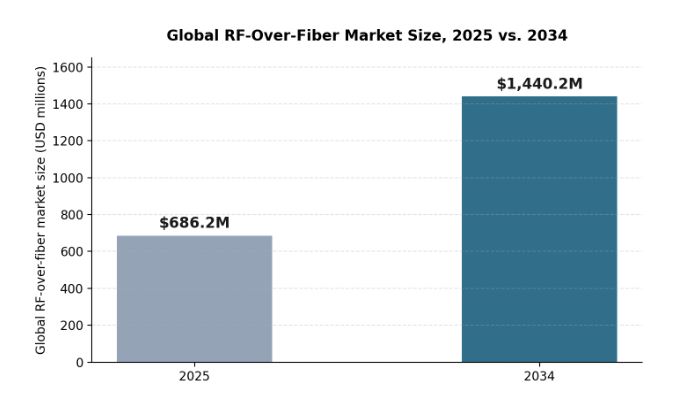
Global RF-over-fiber market size, 2025 versus 2034, according to Fortune Business Insights.
What’s actually inside a converter RF module?
Every RF over fiber link relies on a pair of converter RF modules, one acting as transmitter, one as receiver, and understanding what each does clarifies why the technology performs the way it does:
| Module | What it does |
|---|---|
| Transmitter (Tx) | Takes the incoming RF signal and modulates it onto a laser diode, converting it into an optical signal for transmission over fiber. |
| Receiver (Rx) | Uses a photodiode, typically paired with a low-noise amplifier, to convert the optical signal back into an RF signal matching the original input. |
| Single-mode fiber | Carries the modulated optical signal between Tx and Rx with minimal loss, largely independent of the RF frequency being carried. |
| Monitor & control interface | Lets an operator adjust gain, attenuation, and other parameters remotely over USB, Ethernet, or a web-based interface. |
A representative example is a 6.0GHz programmable RF over fiber converter, which pairs a Tx and Rx module covering 1 MHz to 6 GHz, supports both 50 and 75 ohm impedances, and can be monitored remotely through an SNMP, HTML, or REST interface once installed in an enclosure.
Where do coax vs. fiber tradeoffs matter most in practice?
The coax vs fiber question really comes down to distance and signal integrity. The coax vs. fiber decision comes up most often in applications where signal has to travel further than a short jumper cable, or where the frequency involved is high enough that coax loss becomes a real design constraint. RFOptic’s standard RF over fiber links are used across distributed antenna systems (DAS), GPS and timing signal distribution, radar and altimeter testing, and defense and satellite communications, environments where a coax run would either be impossible at the required distance or would introduce more loss than the application can tolerate.
In distributed antenna systems specifically, RF over fiber extends coverage from a central hub to remote antennas throughout a large building, stadium, or campus, something that would require running dozens of separate low-loss coax runs, each fighting the same distance and frequency limitations described above.
When does it make sense to switch from coax to RF over fiber?
- Distance: the cable run is longer than a coax link can support without unacceptable signal loss, often past a few hundred feet at higher frequencies.
- Frequency: the application operates at a frequency where coax attenuation per foot becomes steep, such as cellular, GPS/GNSS, or higher microwave bands.
- Electromagnetic interference: the signal path runs through an environment with heavy EMI, where fiber’s immunity to electromagnetic interference protects signal integrity in a way shielded coax cannot fully match.
- Multiple channels: several RF signals need to travel the same physical path, which wavelength-division multiplexing (WDM) can combine onto a single fiber rather than requiring a separate coax run for each.
Frequently Asked Questions
Is RF over fiber the same thing as RF over glass?
Yes. “RF over glass” and “RF over fiber” (often abbreviated RFoF) refer to the same underlying technology; the terms are used interchangeably in the industry.
Does RF over fiber change the RF signal in any way?
In principle, no. A well-designed RF over fiber link is transparent: the RF signal recovered at the receiver should match the original input, aside from small amounts of gain, noise, and distortion introduced by the conversion process itself.
Can RF over fiber carry more than one signal on the same fiber?
Yes. Using wavelength-division multiplexing (WDM), multiple RF signals can be carried simultaneously on a single fiber, each on its own optical wavelength, reducing the number of physical fiber runs needed.
Why is fiber loss so much less sensitive to frequency than coax loss?
Coax loss increases with frequency because of factors like the skin effect and dielectric loss in the cable’s insulation, both of which get worse at higher frequencies. Fiber carries the signal as modulated light rather than as an electrical signal traveling through a conductor, so its loss is governed by the optical properties of the glass itself, which stay essentially flat across the RF frequencies being carried.



Key Takeaways
|
What is IP bonding, and why was it actually invented?
IP bonding was invented to address a specific, practical problem: for anyone trying to deliver live streams via early cellular technologies like 3G and 4G, a single connection was never sufficient for throughput or reliability on its own. LiveU’s own explanation of the technology describes how bonded streaming solves this: technologies use multiple cellular connections, plus available WiFi and Ethernet, to improve both characteristics simultaneously, enabling contributors to affordably deliver high-quality video from locations that would otherwise have been inaccessible, whether practically or economically.
How does the packet distribution and reassembly process actually work?
Every contribution encoder relies on this same underlying process. Under the hood, a compressed video file is divided into multiple packets, distributed across all available transport mechanisms at once. Once those packets are delivered to the cloud, they’re reassembled back into the original video file, which can then be distributed to multiple private or public destinations, including social media platforms. When a stream is sent to a decoder instead, the reassembled packets are typically input into a linear TV production through standard broadcast video outputs. This distributed-then-reassembled approach is exactly what lets bonded streaming survive the loss or degradation of any single connection without losing the overall stream.
What role does a dedicated transport protocol play in making bonding actually reliable?
Bonding multiple unpredictable cellular connections into one stable stream requires more than simply splitting data across them; it requires a protocol purpose-built for the job. LiveU Reliable Transport (LRT™) is a point-to-point, low-latency, high-resiliency protocol created specifically to accommodate the particular properties of cellular and LTE networks and the specific demands IP bonding places on them. One key capability is packet ordering, which simplifies reassembling video after packets travel over different transport mechanisms and inevitably arrive out of sequence. The protocol also applies dynamic forward error correction, a technique that improves both reliability and throughput by allowing lost data to be reconstructed rather than requiring retransmission.
What does a contribution encoder actually need to support in practice?
| Capability | Why it matters for contribution encoding |
|---|---|
| Multi-network bonding | Combining cellular, WiFi, Ethernet, and satellite connections maximizes available bandwidth and resiliency. |
| Frame-synced multi-camera support | Production-level encoders need to keep multiple camera feeds synchronized for multi-angle coverage. |
| HEVC/H.264 encoding options | HEVC delivers the same quality in roughly half the bandwidth, valuable when cellular capacity is limited. |
| Remote monitoring and management | Field teams need to troubleshoot and adjust encoder settings without requiring physical access to the unit. |
Point-to-point contribution encoders illustrate how these capabilities come together in a rackmount form factor: production-level 4K 10-bit HDR encoding supporting up to four fully frame-synced feeds over two bonded public IP connections, with optional cellular bonding available for extra resiliency or seamless failover when a primary connection degrades.
How widely relied upon has bonded streaming actually become?
Bonded cellular transmission has moved from a niche technical workaround to a mainstream newsgathering standard. A 2022 Broadcast Bridge survey of US regional TV stations found that most respondents used bonded cellular for roughly 80% of their news coverage, a figure that highlights how thoroughly this approach has replaced older, more expensive alternatives like satellite trucks for routine, day-to-day remote contribution. Bonded IP solutions generally deliver a strong combination of reliability, mobility, and cost efficiency, often at a fraction of the operational cost of satellite trucks or fixed fiber installations.
How is demand for the broadcast infrastructure behind bonded streaming actually growing?
The broader broadcast equipment category, which includes the encoders, decoders, and transmission infrastructure bonded streaming depends on, continues to grow steadily as the industry shifts toward IP-based workflows. IMARC Group’s broadcast equipment market analysis values the global market at $5.8 billion in 2025, projected to reach $8.3 billion by 2034, a compound annual growth rate of 3.82%. The report specifically credits rising demand for alternatives to existing broadcast infrastructure, since IP-based solutions enable broadcasters to reduce latency, improve content delivery, and streamline operations across many platforms simultaneously.
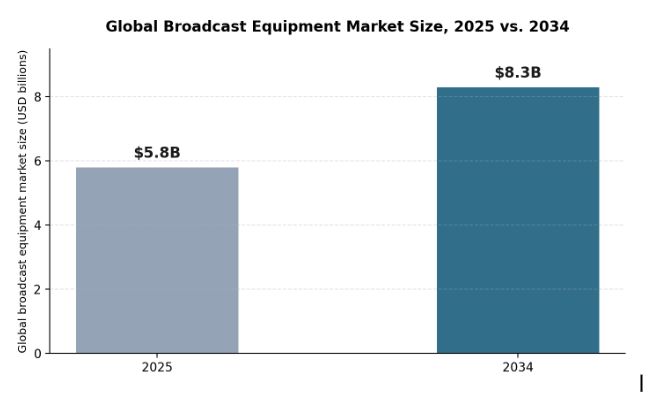
Global broadcast equipment market size, 2025 versus 2034, according to IMARC Group.
What should you actually check when evaluating a bonded streaming setup?
- How many connections can actually be bonded simultaneously? More available connections generally means higher resiliency and greater available bandwidth.
- Does it support both cellular and non-cellular transport? WiFi, Ethernet, and satellite options matter for venues where cellular coverage alone isn’t sufficient.
- What encoding options are available? HEVC support can meaningfully reduce bandwidth requirements compared to older H.264-only encoders.
- Can the unit be monitored and adjusted remotely? Central cloud management reduces the operational burden of troubleshooting units already deployed in the field.
How does bonded streaming actually handle a low earth orbit satellite connection?
Modern bonded streaming systems increasingly treat low earth orbit (LEO) satellite services, such as Starlink, as just another connection type to bond alongside cellular, WiFi, and Ethernet, rather than as an entirely separate transmission path requiring its own dedicated workflow. That matters practically for locations with poor or nonexistent cellular coverage, remote wilderness areas, rural events, or disaster zones where cell towers may be damaged or overwhelmed, since a bonded system can lean more heavily on the satellite connection precisely where cellular capacity is weakest, without requiring the operator to manually switch between systems mid-broadcast. Cutting production costs by using IP transmission over the public internet, private networks, or LEO connections is increasingly part of the same underlying bonding logic that made cellular bonding practical in the first place.
What operational lessons have two decades of bonded streaming deployment actually taught the industry?
Two decades of real-world bonded streaming deployment have surfaced a few consistent lessons for production teams. First, redundancy matters more than raw peak bandwidth in most field conditions, since a slightly lower but consistently available bitrate produces a more usable broadcast than a higher peak bitrate that periodically drops out. Second, the specific mix of network types bonded together should match the actual deployment environment, a dense urban event benefits from cellular diversity across multiple carriers, while a remote rural location benefits more from satellite backup. Third, remote monitoring and management capability has become a practical necessity rather than a convenience, since field crews increasingly need to troubleshoot connectivity issues without a dedicated engineer physically present at every single remote location a broadcast originates from.
Frequently Asked Questions
Is IP bonding the same thing as bonded streaming?
The terms are closely related. IP bonding refers to the underlying technique of combining multiple network connections into one path. Bonded streaming describes the broader practice of using that bonded connection to deliver live video.
Does bonded streaming only work with cellular networks?
No. While cellular bonding is common, bonded streaming can combine cellular connections with WiFi, Ethernet, and satellite links (including LEO satellite services), drawing bandwidth from whichever combination of networks is actually available at a given location.
What happens if one of the bonded connections drops during a live broadcast?
A well-designed bonding system continues transmitting over the remaining active connections, and technologies like dynamic forward error correction help reconstruct data lost during the disruption, so the overall stream typically continues without a visible interruption.
Why is HEVC encoding relevant to bonded streaming specifically?
HEVC (H.265) delivers the same video quality in roughly half the bandwidth of H.264, which matters directly for bonded cellular transmission, where available bandwidth is often the primary constraint on stream quality.
Key Takeaways
|
What are edge video intelligence solutions, exactly?
Edge video intelligence solutions are systems that combine video analytics with edge computing, embedding intelligent video processing capability directly onto edge devices rather than routing raw footage back to a centralized server for analysis. Maris-Tech’s own definition of the category frames this clearly: a sophisticated onboard architecture enables real-time and accurate video and AI processing, such as object detection, classification, and tracking, all performed on the device itself. That distinction, processing at the source rather than after transmission, is what enables the quick response times and decision-making that surveillance and defense applications increasingly require.
What is embedded video processing, and why does it matter for compact devices?
Embedded video processing refers to integrating video processing capability directly into a hardware device, rather than relying on external computing resources to handle that workload after the fact. Maris-Tech’s own explanation of the concept highlights exactly why this matters for compact and remote platforms specifically: it allows a device to handle complex video and audio data efficiently within itself, which is particularly beneficial for devices like drones that can’t practically depend on a nearby external processor. Removing that dependency also removes a potential point of failure, since the device no longer needs a stable, continuous connection to a separate processing system just to make sense of what its own sensors are capturing.
What does a complete edge video intelligence pipeline actually involve?
Real-world edge video intelligence isn’t a single processing step; it’s a coordinated pipeline where each stage depends on the one before it functioning correctly.
| Pipeline stage | What it does |
|---|---|
| Acquisition | Captures multi-sensor video and data, spanning HD, thermal, infrared, and RF sources. |
| Processing | Compresses and encodes captured video (H.264/H.265), optimizing it under real-world bandwidth constraints. |
| AI analysis | Runs onboard analytics for object detection, classification, tracking, and behavior inference. |
| Application & distribution | Delivers situational awareness through intuitive interfaces and streams data securely over narrowband or satellite networks. |
A weak point at any single stage of this pipeline degrades the whole system’s usefulness. Excellent AI analysis is wasted if the acquisition stage delivers unstable footage, and flawless processing means little if the distribution stage can’t reliably deliver the resulting stream to the people who need it, particularly over the narrowband or contested communication links common in defense and remote operations.
How large is the market driving investment in this kind of edge processing?
Edge AI has moved from a specialized capability to a mainstream computing priority across a wide range of industries. Grand View Research’s edge AI market analysis values the global market at $24.91 billion in 2025, projected to reach $118.69 billion by 2033, a compound annual growth rate of 21.7%, driven by growing demand for real-time data processing, expanding IoT device deployment, and rising 5G-enabled applications in areas like autonomous systems and mission-critical operations. The hardware segment specifically dominates current revenue share, reflecting how much of this market’s growth still depends on physical devices capable of running AI workloads locally.
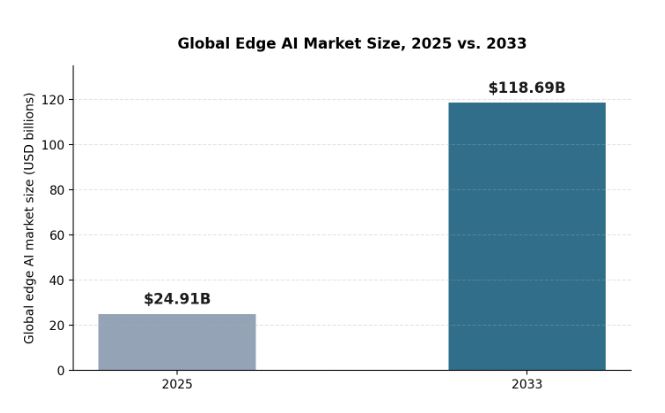
Global edge AI market size, 2025 versus 2033, according to Grand View Research.
What advantages does processing video at the edge actually deliver?
- Reduced latency: analysis happens where the data is captured, removing the round-trip delay of sending raw footage elsewhere first.
- Lower bandwidth demand: transmitting processed insights or compressed streams requires far less bandwidth than raw, unprocessed video.
- Operational resilience: a device that processes its own video keeps functioning usefully even if its connection to a remote system is degraded or lost.
- Faster decision-making: real-time object detection and tracking at the source shortens the time between an event occurring and a response being possible.
Where do these capabilities get applied in practice?
Edge video intelligence solutions and embedded video processing aren’t confined to a single industry. They support intelligent video surveillance with object recognition and behavior analysis for actionable intelligence, and they extend into defense and smart city management, sectors where instantaneous analysis and decision-making genuinely change operational outcomes rather than just adding convenience. The modular design behind these systems also supports easy integration with diverse platforms, which matters because the same underlying edge processing capability often needs to serve very different host devices, from a fixed installation to a small airborne platform, without requiring a completely different architecture for each one.
What environmental demands do these systems have to withstand?
Edge video intelligence hardware rarely operates in a controlled, climate-managed environment the way a typical data center server does. Platforms deployed on UAVs, ground vehicles, or fixed outdoor installations routinely face vibration, temperature extremes, moisture, and dust that would quickly degrade consumer-grade electronics. Ruggedized video processing and streaming solutions built for this reality typically carry IP67-rated water and dust resistance alongside MIL-STD environmental protection, specifications that describe tested tolerance for shock, vibration, humidity, and temperature cycling rather than marketing language alone. That ruggedization matters as much as the underlying processing capability, since a technically capable system that fails in field conditions delivers no situational awareness at all.
How does modular architecture actually reduce integration cost for platform manufacturers?
A manufacturer building a new UAV, ground robot, or surveillance tower doesn’t need to design a video processing system from scratch if the underlying edge intelligence hardware is built with modular integration in mind. Board-level and OEM modules are specifically designed to be embedded directly into a manufacturer’s own systems, adding advanced AI and video capabilities without increasing footprint or power draw beyond what the host platform can accommodate. This approach lets a manufacturer focus engineering effort on their platform’s core differentiation, whether that’s flight endurance, payload capacity, or mobility, while relying on proven, field-tested edge video intelligence components for the video and AI processing layer specifically.
Frequently Asked Questions
What’s the difference between edge video intelligence and standard video analytics?
Standard video analytics often processes footage after it’s been transmitted to a centralized server. Edge video intelligence performs that analysis directly on the device capturing the footage, reducing latency and bandwidth requirements while removing dependency on a continuous connection to external processing resources.
Why is embedded video processing especially important for drones specifically?
Drones are compact, remote, and often operate with limited or contested communication links. Embedded video processing lets a drone handle complex video and audio analysis using its own onboard hardware, rather than depending on a stable connection to an external processor that may not always be available.
Does edge video intelligence replace the need for AI analysis entirely?
No, AI analysis is one stage within the broader edge video intelligence pipeline, alongside acquisition, processing, and distribution. Edge video intelligence describes the overall architecture; AI analysis is one of the specific capabilities that architecture enables at the edge.
What industries rely most heavily on edge video intelligence solutions?
Defense, homeland security, and unmanned systems are among the most demanding use cases, given their requirements for real-time situational awareness and reliable operation without constant connectivity, but the same underlying technology also supports smart city management and general surveillance applications.

Key Takeaways
|
What is the Power BI data exposure issue, exactly?
Every Power BI report is built on top of a semantic model, which represents all the data that could be used for visualization, while the report itself defines which data actually becomes visible in the interface and how. The problem is that when a report is shared, whether explicitly or implicitly by sharing the workspace it lives in, the entire underlying semantic model becomes accessible too, not just the parts a viewer can see on screen. That includes detailed records behind aggregated numbers, tables marked “hidden” in the model, non-displayed columns of visible tables, and detailed records that a report’s own filters were supposed to exclude.
Why does hiding a table or column in Power BI not actually secure it?
This is the part that catches most report owners off guard. Kanopy Security’s research into this exposure found that Power BI’s query API doesn’t check whether a table or column has been marked hidden before returning it; a user can request the name of a hidden “secrets” table, or ask for a column excluded from every visual, and the underlying query engine will return it anyway, as long as that table or column exists somewhere in the semantic model the report is built on. The behavior affects reports shared internally within an organization just as much as reports published openly to the web.
How large is the publicly exposed PowerBI surface, really?
Because so many organizations publish Power BI reports to the open web for legitimate reasons, sharing dashboards with customers, partners, or the public, that publishing habit alone creates a large attack surface once this exposure issue is factored in. A simple search engine query targeting Power BI’s public report URL pattern returns well over 160,000 results, and narrowing that query toward a specific business topic, such as adding a keyword like “sales”, can still return tens of thousands of more targeted matches.
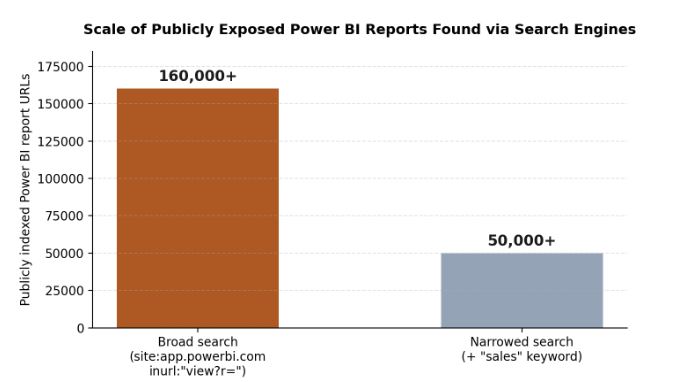
Publicly indexed Power BI report URLs found via a broad search engine query versus a topic-narrowed query.
Not every one of those results is exploitable, plenty are sample reports created by consultants or service providers to demonstrate their own skills. But manual review of even a small, randomly sampled subset of real organizational reports turns up genuine examples: state government sites unintentionally exposing protected health information, universities exposing employee data, and municipalities exposing personally identifiable information, all through reports their owners likely assumed were safely aggregated or filtered.
Does Microsoft consider this a vulnerability?
No, and that distinction matters for how organizations need to respond. Microsoft was notified through its official vulnerability disclosure channel and confirmed the behavior within two days, but classified it as a feature rather than a vulnerability, which independent reporting on the issue also noted at the time, describing how Microsoft’s stance leaves report owners themselves responsible for configuring semantic models securely, since no patch addressing the underlying behavior should be expected.
How does the exploit actually work, technically?
Running a Power BI report requires an API call that fetches the data to be displayed, a request sent to one of Power BI’s query endpoints depending on whether the report is public or restricted to an organization. The request payload is a query, in Power BI’s own proprietary format, specifying which columns and tables to retrieve, and the response returns that data as JSON. Because the query API doesn’t check whether a requested column or table is marked hidden in the semantic model, a user can simply ask for a hidden table by name and receive its contents. A separate API call, used internally to help generate the report itself, can also be used to enumerate the entire semantic model’s schema, including hidden tables and columns, giving anyone who wants to explore a report’s underlying data a roadmap for exactly what to ask for.
What kinds of organizations have been found exposed?
Manual review of a sample of publicly indexed reports turned up real examples across very different sectors, which underscores that this isn’t a niche risk limited to one industry:
- State government sites, unintentionally exposing protected health information (PHI) through reports meant to share only aggregate public health statistics.
- Universities, exposing employee data through reports intended to show only summarized institutional metrics.
- Municipalities, exposing personally identifiable information (PII) through reports built to share only anonymized community data.
- Commercial organizations, sharing what they believed were safely filtered sales, financial, or operational dashboards with partners or the public.
In each case, the organizations involved almost certainly believed their reports were safe to share, since the visible dashboard showed only the aggregated or filtered view they intended. The underlying semantic model told a different story.
What actually needs to change to fix exposed PowerBI reports?
| Common mistake | What to do instead |
|---|---|
| Marking a table or column “hidden” in the model | Remove it from the semantic model entirely rather than relying on the hidden flag, which the query API ignores. |
| Filtering sensitive rows only in the report’s visuals | Restrict the data source itself using a Power Query expression, so filtered rows are never part of the semantic model to begin with. |
| Aggregating sensitive columns only in the display | Aggregate the data at the data source level, or exclude sensitive columns from the semantic model before it reaches the report. |
| Assuming a one-time review is sufficient | Audit Power BI environments regularly for reports that were published to the web unintentionally or overshared internally. |
How can an organization check its own exposure?
Because this isn’t a bug that gets patched centrally, checking exposure has to happen at the organization level. Kanopy Security’s data leakage prevention capability continuously monitors data usage patterns across business-built platforms, including Power BI, surfacing risky sharing configurations and unexpected data movement as they happen rather than waiting for a periodic audit to catch them. For a quicker, self-directed first check, Kanopy also released the Power BI Analyzer, a free, open source scanning tool that reviews an organization’s Power BI environment for reports published to the web or widely shared internally, then flags any that carry more underlying data than the report actually displays.
- Start with reports published to the web, since they carry the highest exposure risk to anyone who finds the URL.
- Check for hidden tables and columns specifically, since “hidden” in Power BI’s UI does not mean inaccessible through its API.
- Review widely shared internal reports too, since the same exposure applies to anyone with access to the workspace, not just the public web.
- Repeat the audit on a schedule, since new reports get published continuously and a one-time review goes stale quickly.
Frequently Asked Questions
What is the Power BI data leakage vulnerability that Kanopy Security discovered?
A flaw in how Power BI reports work: every report runs on a semantic model holding all the underlying data, but when a report is shared or published to the web, the entire semantic model, including hidden tables, hidden columns, and filtered-out records, stays accessible through Power BI’s own query API, even though none of it appears in the visible report.
Does Microsoft consider the Power BI data exposure a vulnerability?
No. Kanopy reported the issue to the Microsoft Security Response Center on May 16, 2024, and Microsoft confirmed the behavior two days later, on May 18, 2024, but classified it as a feature, not a vulnerability. That means no fix is coming, and it falls to report owners to configure their semantic models securely.
How can an organization check if its Power BI reports are exposing hidden data?
Kanopy Security built and open-sourced a free tool, the Power BI Analyzer, which scans an organization’s Power BI environment for reports published to the web or widely shared internally, then flags any that carry more underlying data than what the report actually shows.
How can I stop my Power BI reports from leaking hidden data?
Remove hidden tables and columns from the semantic model entirely rather than just hiding them, use Power Query expressions to restrict the data source to only the subset that should be shared, and make sure aggregated views pull only from non-sensitive columns. Audit Power BI environments regularly for reports published to the web by accident.
RF Over Fiber (RF Over Glass): Why Radio Frequency Signals Are Moving to Fiber

Bonded Streaming and IP Bonding: How Contribution Encoders Actually Work
Edge Video Intelligence Solutions and Embedded Video Processing, Explained

-

 Business Solutions2 years ago
Live Video Broadcasting with Bonded Transmission Technology
-

 Business Solutions1 year ago
The Future of Healthcare SMS and RCS Messaging
-

 Business Solutions2 years ago
2-Way Texting Solutions from Company Message Services
-

 Business Solutions2 years ago
Communication with Analog to Fiber Converters & RF Link Budgets
-

 DSRC Communication1 year ago
The Crossroads of Connectivity: DSRC vs. C-V2X Technologies in Automotive Communication
-

 Business Solutions2 years ago
Wholesale SMS Platforms with OTP Services
-

 Business Solutions2 years ago
Choosing the Right B2B Digital Marketing Agency: A Guide
-

 3D Technology1 year ago
How Multispectral Cameras Advance Book Scanning